
Auvenir Ratio Analysis
Product Manager: Haaris Mian
Product Designer: Joshua Lee
This project is covered under an NDA. Some names and design artifacts have been omitted.
The Chartered Professional Accounts of Canada or CPA Canada, is the governing body that sets up standards for how audits should be performed. In recent years there has been a push to perform more analytical work within an audit engagement to provide more quantifiable justifications for audit decisions. Ratio analysis can be used to help provide this audit evidence as it's the comparison of financials against prior year or industry benchmarks.. It gives a visual representation of how the company is doing. We started with some research to understand the complexities that small to medium sized accounting firms face in performing analytics as part of their audits. Through speaking with CPA Canada we learnt that ratio analysis was one of the analytics that they were asking auditors to perform more.
Research
We interviewed 7 auditors from our target market of small to medium sized audit firms to understand what analytics if any, they perform today and if they don’t currently perform analytics, why they don’t. We specifically asked about ratio analysis and the value it can provide to the auditor. After completing our interviews we performed a thematic analysis of the insights to find some themes and identify specific pain points.
Insights from previous market research
Smaller firms are working on smaller engagements, they have a shorter turnaround time than larger firms with larger clients
They are expected to be more competitive on prices and margins are becoming slimmer
Due to the competitive nature in this market of audits, firms need ways to provide additional value to their clients
Different themes that were discovered during analysis.
During the analysis process we found that
Quantitative
40% of auditors are using analytics within their engagements, of those analytics, they are using preliminary analytics
None of the auditors are currently using ratio analysis
Qualitative
While ratio analysis provides high value, it is not performed because of the time it takes to create one
Auditors cannot trust someone junior to create these analytics as if they are built the wrong way, it will actually provide incorrect evidence and can get the auditor in trouble
Auditors can imagine this being automated and would feel comfortable if this were automated
Goals
Through the interview process, I understood that there was an appetite for automation and that we could easily automate this process. By the time the user would need to create a ratio analysis, Auvenir’s platform would have received all the relevant financial data necessary to automatically generate the ratios. We also understood from researching ratio analysis that there are standard ratios that most people will use and during the interview process we confirmed that these were ratios that the auditors were familiar with. Allowing the system to automatically generate these ratios gave us the ability to address their first pain point. The other pain point auditors mentioned was trusting junior auditors to do the work. It would be necessary to make auditors feel comfortable with any automation that is happening and that the work is being done correctly.
How can we make auditors trust Auvenir’s automated ratio analysis?
Iterations and testing
I started the process by mocking up what our ratio analysis module would look and feel like. Trust being the number one goal, I wanted to make sure there was transparency in how these figures and calculations were happening while not overloading them with information as this would take away from the ease of use. Through an iterative process I tested this internally as well as with some subject matter experts we had in house. Once we had a high fidelity set of designs we also user tested the prototypes to validate the design decisions.
V1
I created a lofi mockup of the ratio laying out what I thought would be important to the auditor.
Feedback
Liked the breakdown of CY and PY figures but felt the visualization could be more prominent
V2
I rearranged the layout of the cards to show the visuals upfront. Also added a little bit more fidelity.
Feedback
The placement of all the information works well, but lacks some details on how the ratio is calculated.
No visibility on how the ratios were being calculated
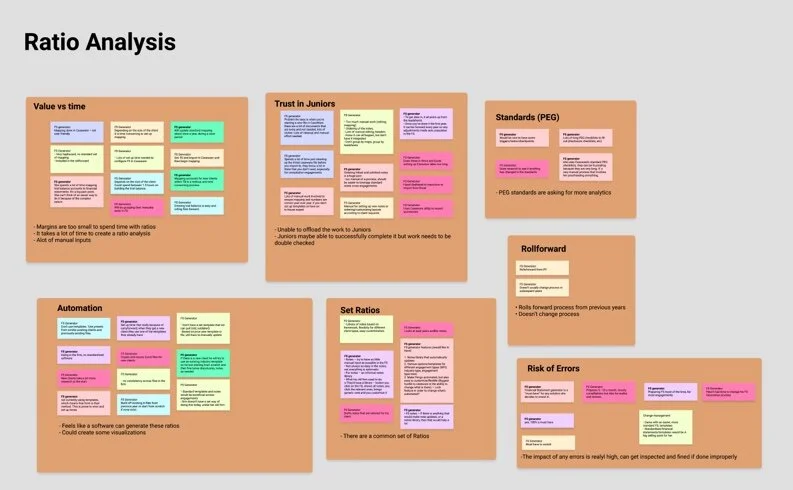
V3
I added the calculated ratios and put the source date into a hover action on an icon next to the legend. This way, the auditors can see the ratios in a numeric and visual view. I also added the formula for the ratio as a legend.
Feedback
The source information is still hidden and they had a hard time understanding how these were calculated.
Enjoyed that they could see the ratios both visually in the chart and in a number format
Would like a way to document their analysis based on the ratios.
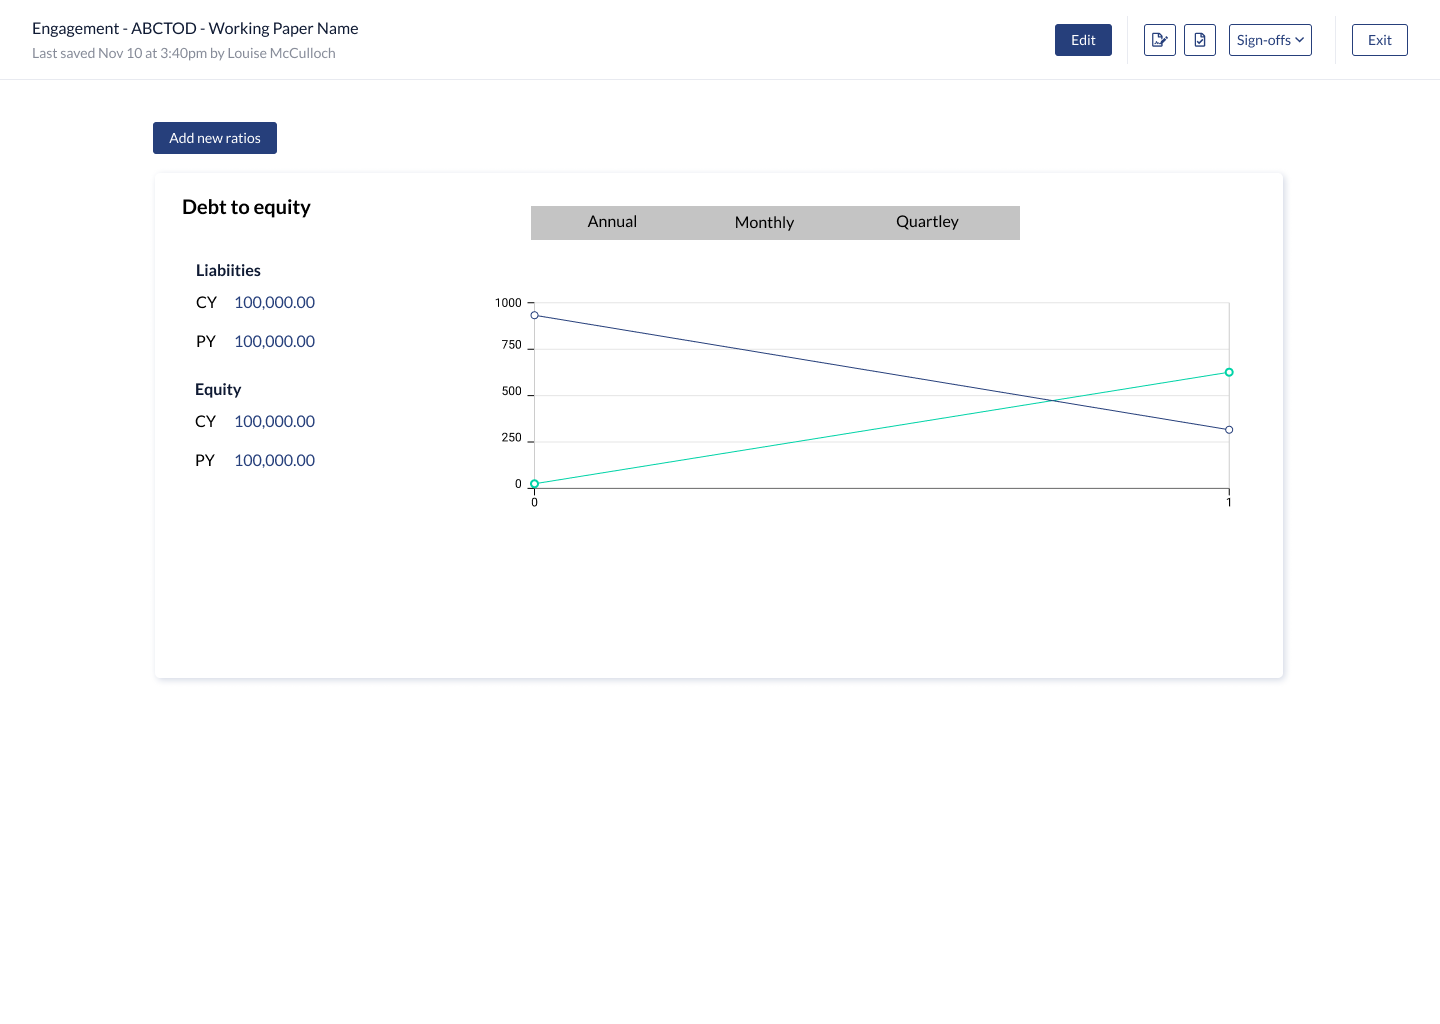
High fidelity designs and user testing findings
For the final design I decided to add a table to the page which showed all the source information as well as tried to update the way we displayed the formula. I also added a spot for the auditor to document any findings.
User testing insights
It was very clear how these ratios are calculated and the users appreciated the visibility of information used
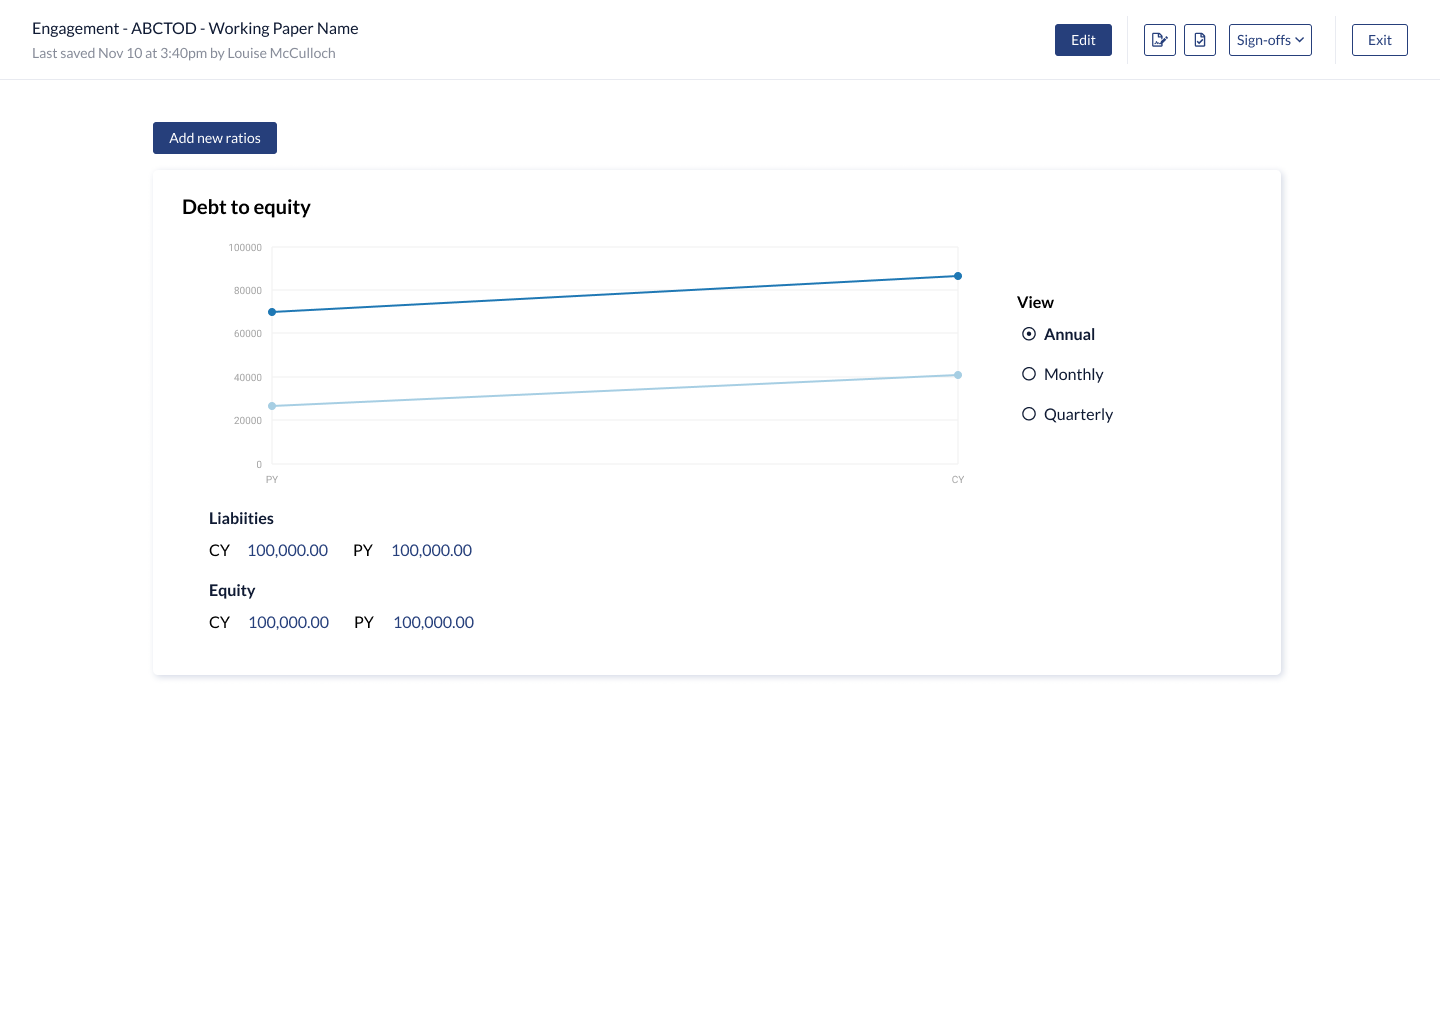
Really liked the ability to get a more granular view of the ratios by year, month and quarter
One thing that was missing was the ability to add a baseline benchmark and comparison
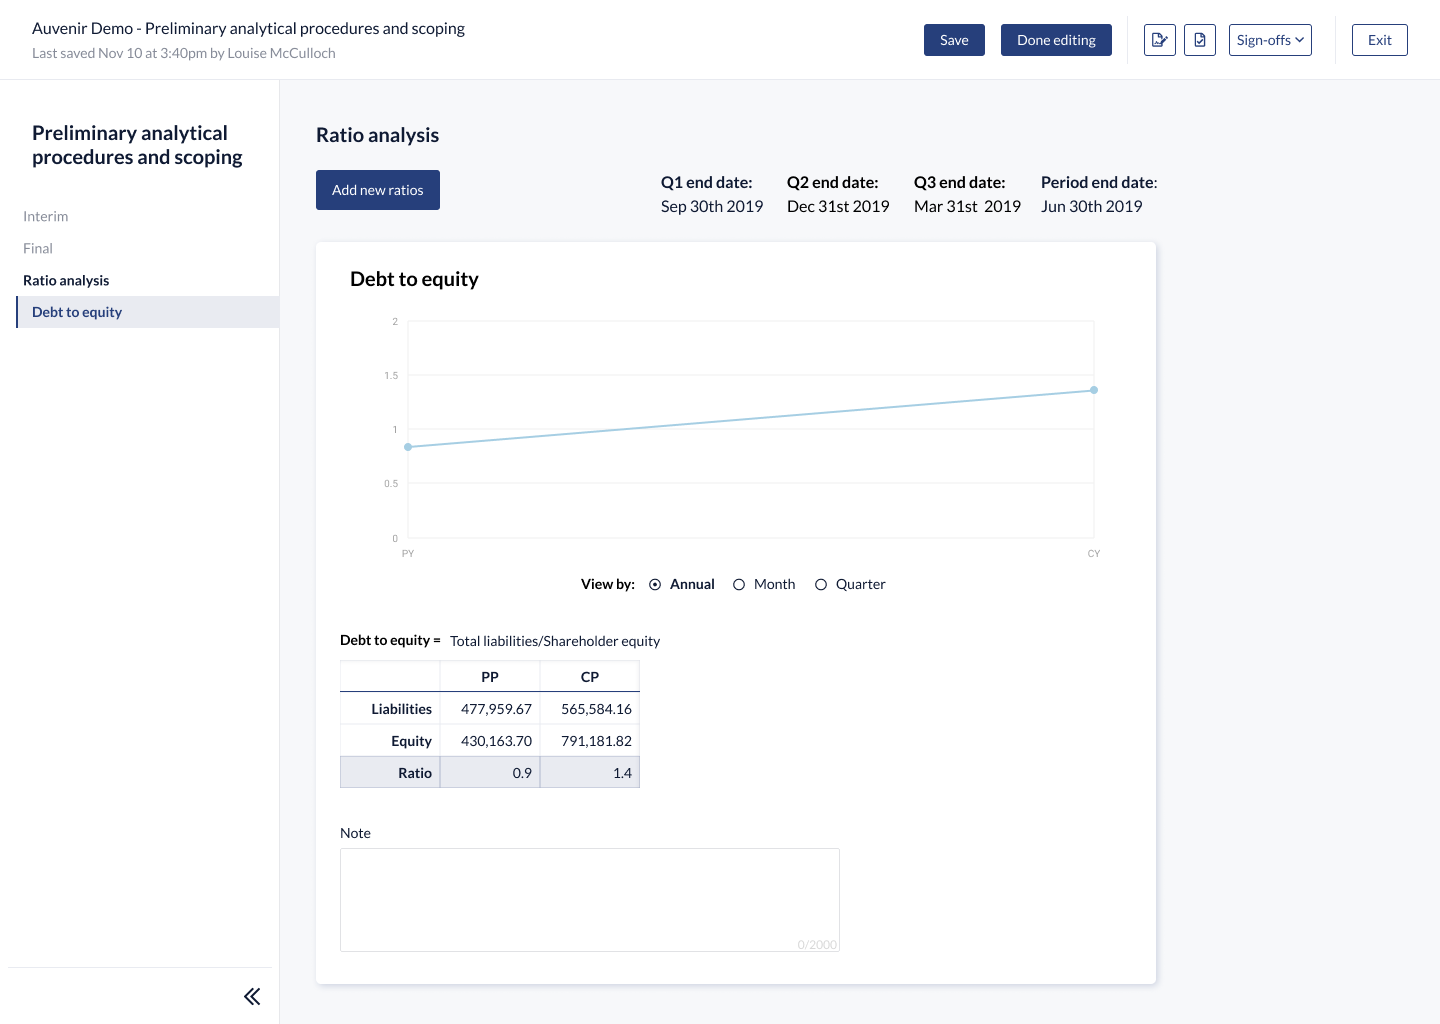
Annual view of a ratio
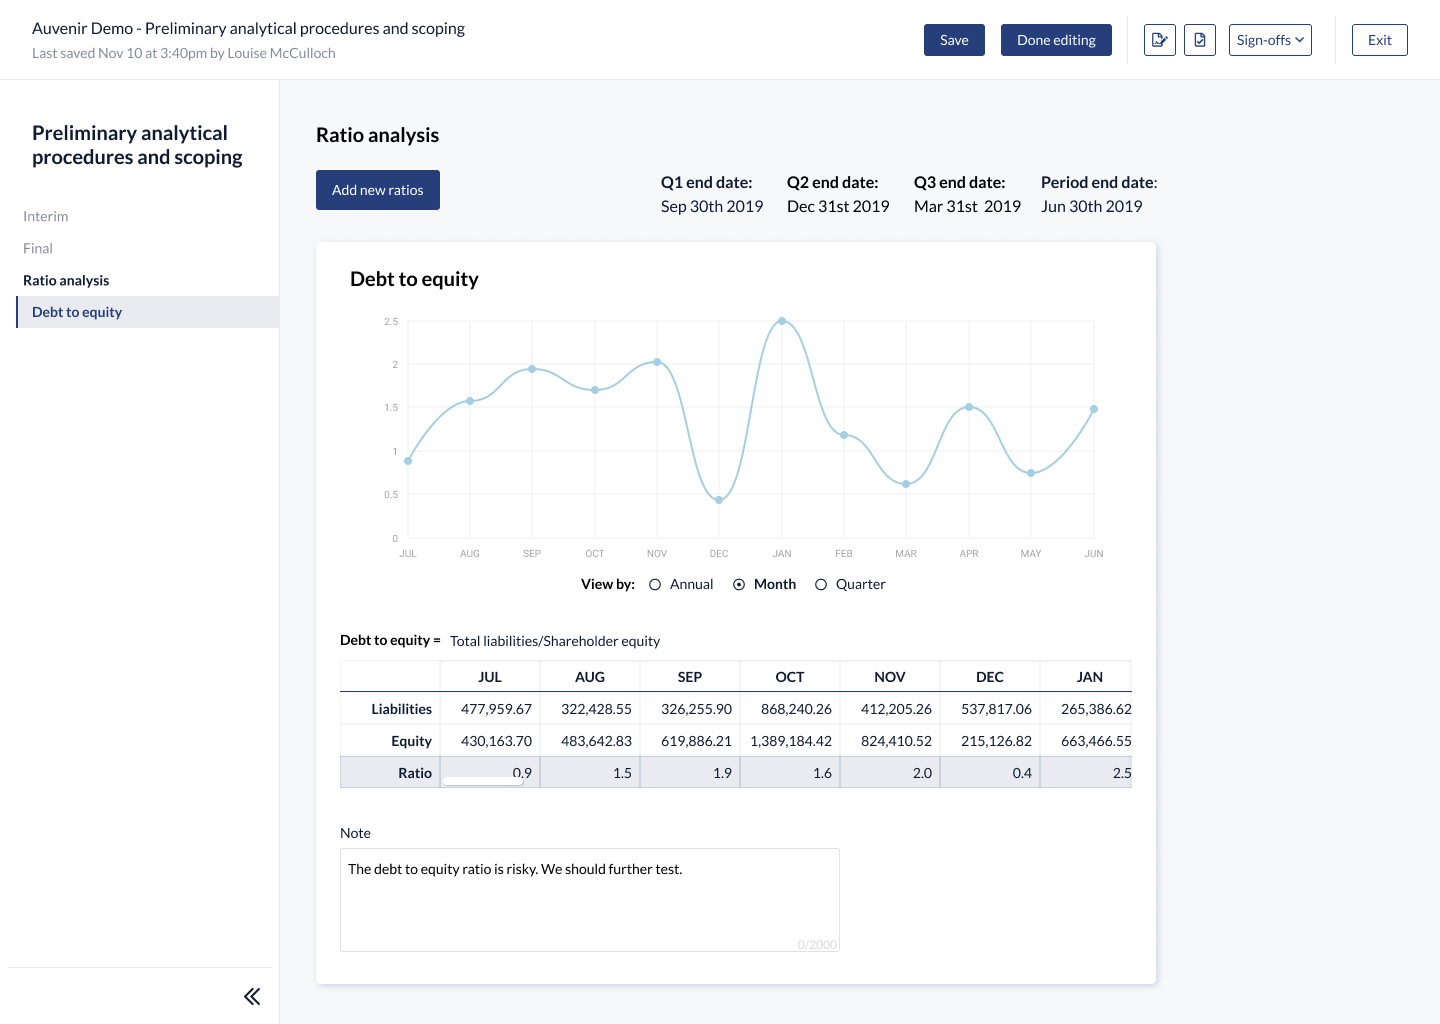
Month view of a ratio
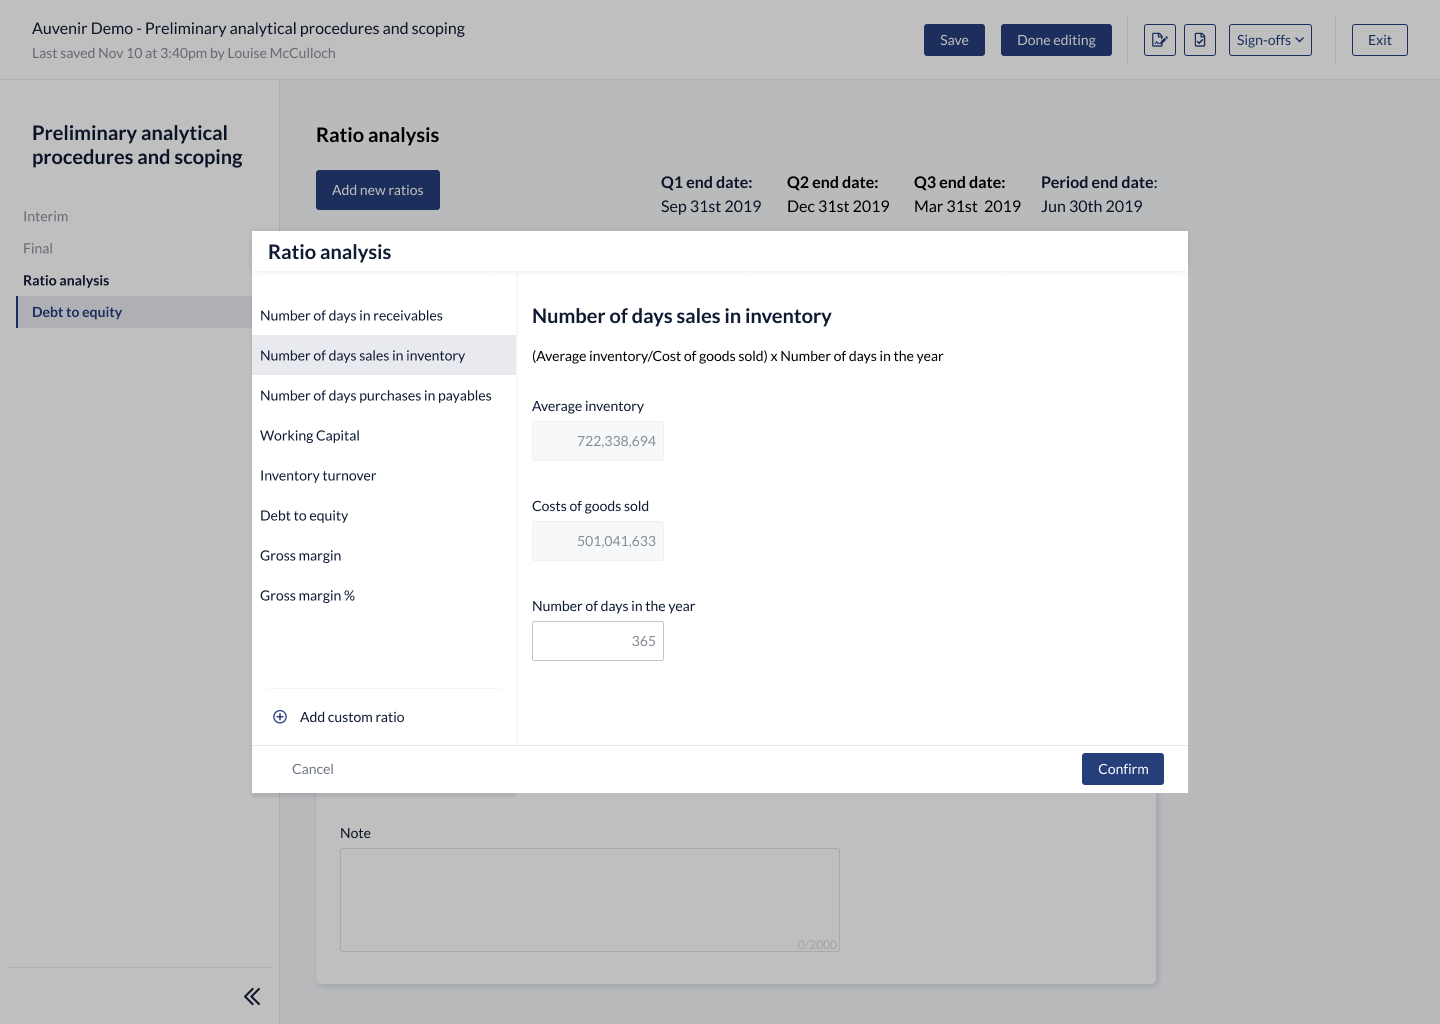
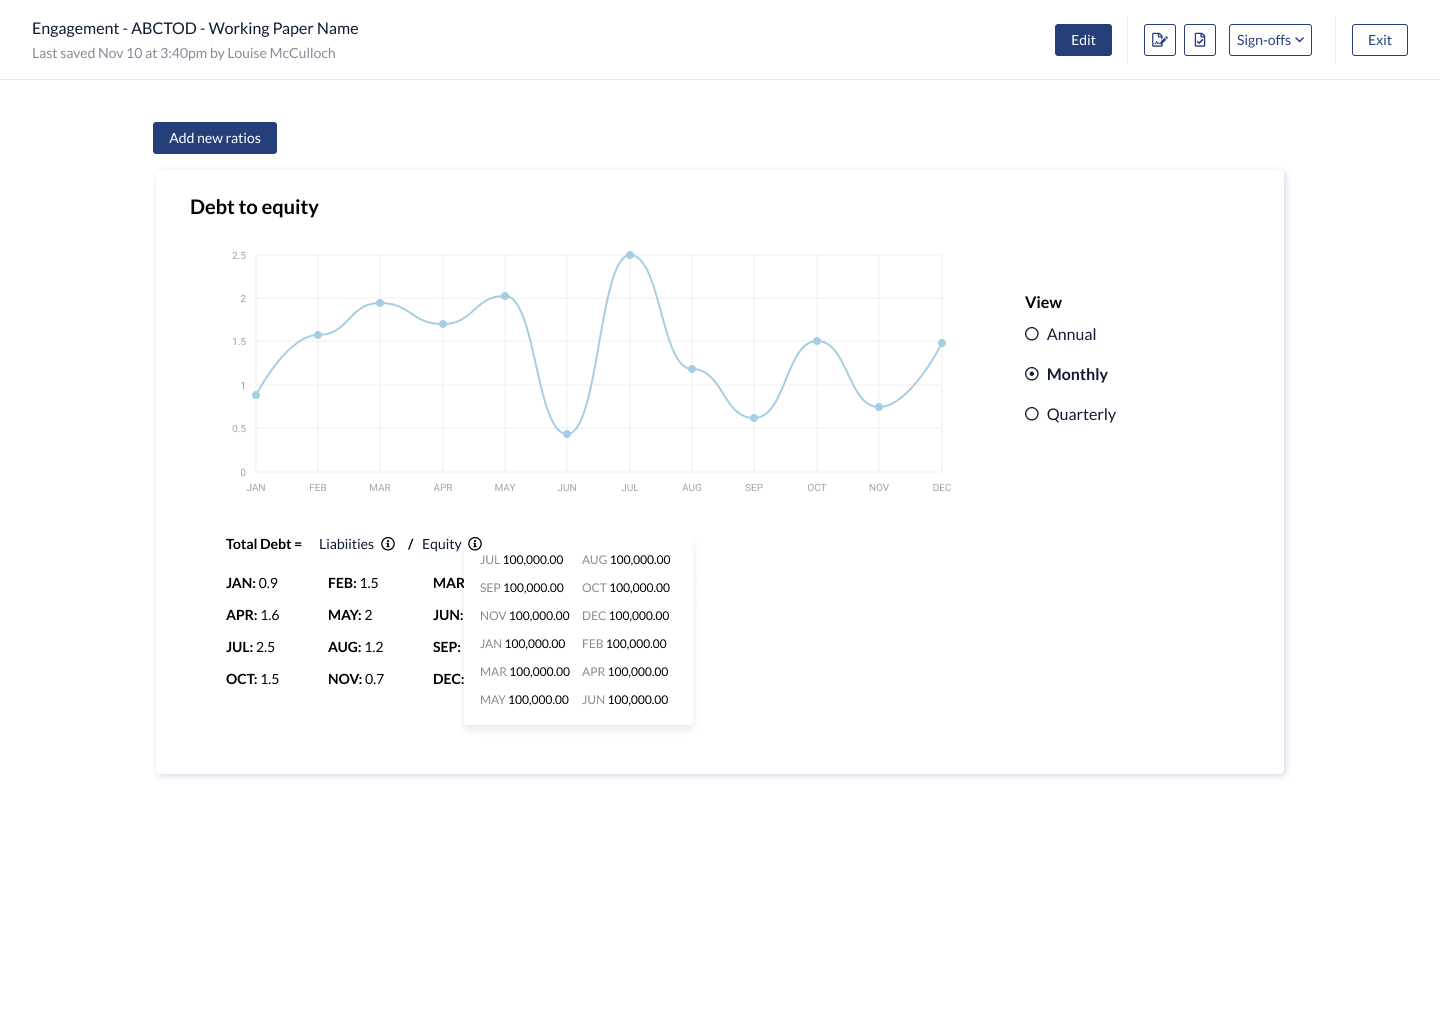
Adding a new ratio
Conclusion
The main thing I learnt working through this project was understanding how we can help auditors feel more comfortable with automation. In a situation where there is a significant risk to auditors if what is produced was incorrect, it was important to gain their trust so that they would feel comfortable with the feature. While some of the information I ended up showing was not necessary for the auditor to perform their work, it gave them more visibility into how things were calculated for them and reassurance as to the validity of the information. While I personally would feel comfortable with a system doing these calculations it was important to empathize with the auditors in these situations when they even have a hard time trusting their own staff to help them with these tasks. Part of the feedback we received during user testing was the amount of value that this could bring to their clients and through this they would be able to spend more time helping their clients by offering more significant recommendations with thorough and in-depth analysis.